

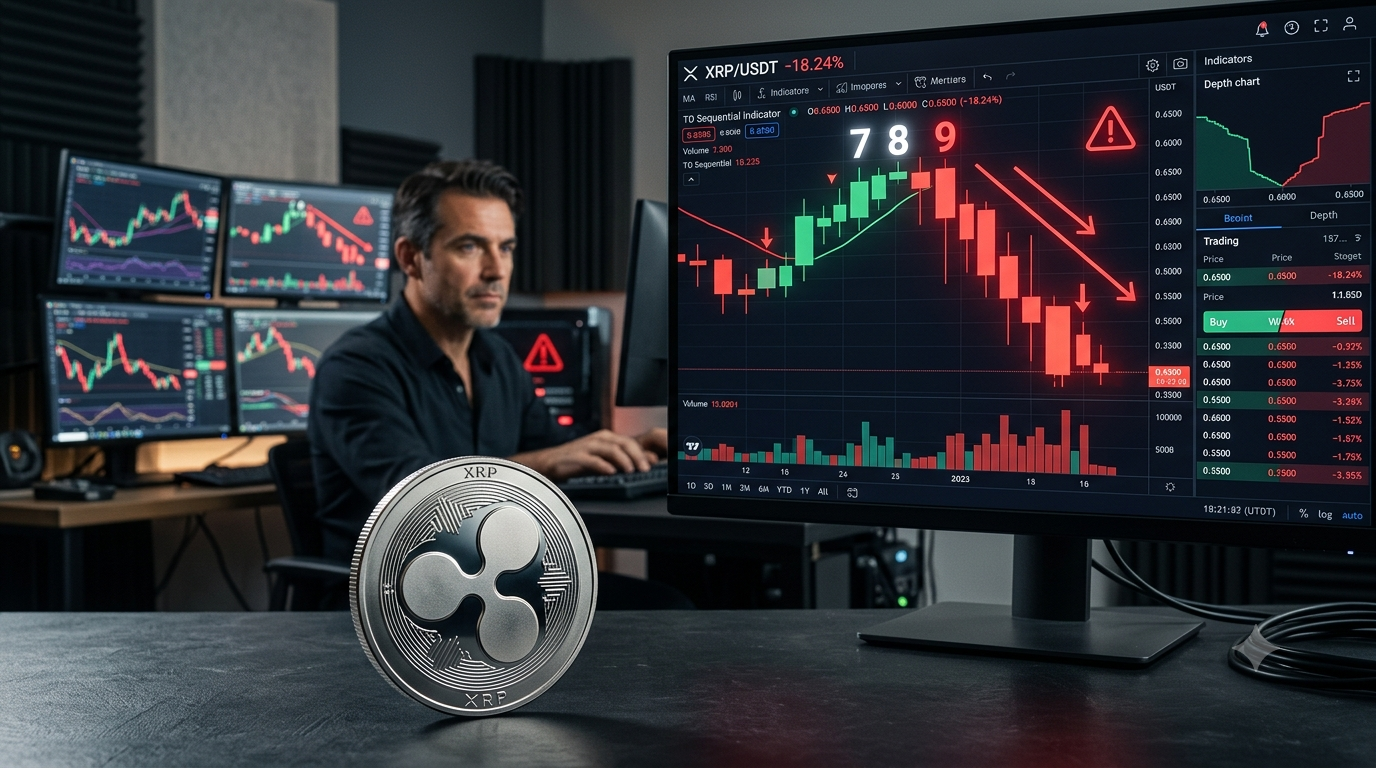
I’ll be honest, the first time someone showed me a TD Sequential chart on XRP, I had no idea what I was looking at. Little numbers stacked above red and green candles, someone in the replies shouting “nine count confirmed,” and everyone acting like they’d just cracked a code. Once you actually learn how it works though, it clicks pretty fast. And once it clicks, you start seeing xrp sell signals td sequential indicator setups everywhere.
- Okay, But What Even Is This Thing
- Why XRP Specifically
- The Setup Count, Step by Step
- Then There’s the Countdown
- Has It Actually Worked on XRP
- Don’t Just Sell Because a Number Appeared
- Mistakes I See People Make Constantly
- Pairing It With Actual Price Levels
- Which Timeframe Should You Even Watch
- Why It’s All Over Crypto Twitter
- Setting It Up Yourself
- Have an Actual Plan Before the Signal Hits
- Risk Management Comes Before Any Indicator
- How It Stacks Up Against RSI and Moving Averages
- Does the History Actually Hold Up
- Final Word
So let’s slow down and go through it properly.
Okay, But What Even Is This Thing
The TD Sequential comes from Tom DeMark, a technician who’s been around markets for decades. His whole idea was simple: trends run out of gas eventually, so why not count exactly how tired a trend is getting?
That’s really it at the core. It’s a counting tool. Nine candles in one direction, then it flags a possible exhaustion point. Keep going, and at thirteen it flags again, harder this time.
When people mention xrp sell signals td sequential indicator readings on Twitter or Telegram, this is what they’re pointing at. A count that’s finished, on the bearish side, right after a stretch of green candles.
Why XRP Specifically
XRP just moves. Anyone who’s held it through a random Tuesday knows this. Up 8%, down 6%, sideways for two days, then a wild candle out of nowhere.
That kind of chop is honestly perfect territory for this indicator. Slow, boring assets don’t give it much to work with. XRP gives it plenty.
I’ve noticed a lot of the bigger XRP chart accounts basically live on this tool now. Some stick to the 4-hour for quick trades, others pull up the daily or even the 3-day chart when they’re hunting bigger moves. Either way, xrp sell signals td sequential indicator chatter tends to spike right after a sharp rally, which makes sense if you think about it.
The Setup Count, Step by Step
Here’s the mechanical part. The indicator compares each candle’s close to the close four bars back. Nine of these in a row, favoring the same direction, and the setup finishes.
It doesn’t have to feel like a perfectly clean, uninterrupted line on the chart in every case, but the rules behind the counting are strict enough that the software handles it for you.
Once that ninth candle lands, and the run was green, you’ve got your bearish reading. Most xrp sell signals td sequential indicator conversations start right at that moment, candle nine.
People screenshot it constantly. Genuinely, it becomes the anchor point for whatever trade idea follows.
Then There’s the Countdown
Some traders don’t stop at nine. They wait for the countdown phase, which pushes the count out to thirteen using a slightly different comparison.
A finished thirteen is usually treated as the heavier signal of the two. When nine and thirteen agree on direction, xrp sell signals td sequential indicator setups get a lot harder for people to shrug off.
Not everyone bothers waiting though. If you’re trading fast timeframes, sitting around for a full thirteen-count can mean missing the move entirely.

Has It Actually Worked on XRP
Yes, sometimes impressively so. There have been stretches where a completed setup lined up almost perfectly with a local top, followed by a real pullback over the next few days.
I’m not going to pretend it’s magic. Plenty of counts have also failed, or the price just kept climbing right through them. But enough xrp sell signals td sequential indicator completions have lined up with real turns that traders keep paying attention.
That track record, imperfect as it is, is exactly why the tool has stuck around
Don’t Just Sell Because a Number Appeared
This part matters more than people give it credit for. A completed sell signal isn’t an order to dump your bags immediately. It’s a flag. A “hey, pay attention” moment, nothing more.
Traders who actually do well with this stuff combine xrp sell signals td sequential indicator readings with other context. Where’s price relative to support and resistance? What’s volume doing? Is the broader market risk-on or risk-off right now?
Leaning on one tool alone, no matter how good its reputation is, tends to end badly eventually. Treat xrp sell signals td sequential indicator completions as one input among several, not the whole decision.
Mistakes I See People Make Constantly
The biggest one: assuming every nine-count means an instant reversal. Sometimes the market just doesn’t care and keeps grinding higher anyway.
Another one is ignoring the bigger trend. A xrp sell signals td sequential indicator reading inside a genuinely strong uptrend might just cause a pause, not a full reversal. Big difference.
And people jump the gun on single candle closes way too often. Waiting for actual confirmation, like a break below recent support, saves a lot of headaches.
Pairing It With Actual Price Levels
The count means more when it lines up with something structural on the chart. If a xrp sell signals td sequential indicator setup completes right at a well-known resistance zone, that’s a much stronger case than a random count in the middle of nowhere.
Think about it this way. XRP creeping up toward a previous swing high, and the setup finishes right there? That overlap is the kind of thing experienced chart readers actively hunt for.
Without that backup from price structure, a signal on its own is honestly kind of weak. Context is everything with xrp sell signals td sequential indicator setups.
Which Timeframe Should You Even Watch
The 4-hour chart throws out signals often. Good for active traders, fine for people who want to be in and out within days.
Daily and 3-day charts are quieter, but when something shows up there, it tends to matter more. Long-term holders lean toward these slower xrp sell signals td sequential indicator reads because they’re less noisy.
Really it comes down to your own style. Scalpers and long-term holders are going to use this thing in completely different ways, and that’s fine.
Why It’s All Over Crypto Twitter
Open X on any given week and someone’s posted a TD Sequential chart on XRP. It’s become a bit of a staple in that corner of crypto.
That’s not just hype for the sake of hype. The tool has genuinely caught real turning points enough times that people trust it, or at least trust it enough to keep watching for the next xrp sell signals td sequential indicator update.
Just keep in mind, past hits don’t guarantee future ones. Markets shift, and nothing works every single time, this indicator included.

Setting It Up Yourself
If you use TradingView, adding this is genuinely a two-minute job. Search the indicator, drop it on your XRP chart, done.
Small numbers will start stacking above and below the candles as they build toward nine or thirteen. Watching those numbers climb gives you a heads up before the actual xrp sell signals td sequential indicator completion even hits.
A lot of traders set alerts for candle nine specifically, so they’re not glued to the screen all day waiting.
Have an Actual Plan Before the Signal Hits
Don’t wait until the count finishes to figure out what you’re going to do. Decide your entries, exits, and how much risk you’re willing to eat, ahead of time.
When a xrp sell signals td sequential indicator setup does complete, having that plan ready takes the emotion out of it completely. You already know your move.
This is honestly the difference between people who trade with discipline and people who just react to whatever’s trending that hour.
Risk Management Comes Before Any Indicator
No tool, this one included, replaces basic position sizing and stop losses. That stuff matters more than any single chart reading ever will.
Even a xrp sell signals td sequential indicator completion that looks textbook perfect can still fail if the broader market decides to do something crazy. That’s crypto, and especially that’s XRP.
Treat every signal as odds shifting slightly in your favor, not a guarantee. That mindset alone will save you money over time.
How It Stacks Up Against RSI and Moving Averages
People ask me this a lot. RSI tells you overbought or oversold based on recent momentum, but it can sit stuck in overbought territory for ages during a real trend.
Moving averages are slower, better for confirming direction than nailing an exact turn.
The sequential count does something different from both. It just counts exhaustion, full stop, regardless of what RSI or the moving averages say. That’s exactly why it pairs so well alongside them instead of replacing either one.
When RSI is overbought, the moving average shows momentum fading, and the count finishes at the same time, that’s when confidence in a reversal really goes up.
Does the History Actually Hold Up
Some traders have gone back years through XRP charts checking how often these completions actually preceded real turns. Results shift depending on the timeframe you’re looking at.
Shorter timeframes throw more signals but smaller, shorter reversals. Longer timeframes give fewer signals, but the moves that follow tend to be bigger and last longer.
None of this is unique to XRP either. Same pattern shows up across plenty of liquid markets, crypto and traditional both.
Final Word
At the end of the day, this indicator has earned its spot in a lot of traders’ toolkits for a reason. It gives you a repeatable, structured way to spot exhaustion instead of just guessing off vibes.
Watching for xrp sell signals td sequential indicator completions can genuinely help with timing exits and dodging tops, as long as you pair it with actual price structure and sensible risk management.
Nothing guarantees a win in crypto. But understanding xrp sell signals td sequential indicator patterns is one more real edge in a market that rarely makes things easy.







Interesting breakdown of the TD Sequential Indicator! The way you explained the sell signals gives a clearer understanding of timing XRP trades effectively. relevant link
The insights on identifying sell signals using the TD Sequential Indicator are quite enlightening! I appreciate how you broke down the nuances of each signal, particularly the emphasis on the importance of market context when making trading decisions. It’s a great addition for anyone looking to refine their XRP trading strategy. this one
The discussion around the TD Sequential Indicator’s ability to highlight potential sell signals for XRP is quite fascinating! I particularly liked how you elaborated on the significance of the countdown periods and how they can indicate shifts in market sentiment. It’s valuable insight for traders looking to navigate the volatility effectively. helpful site
The section on the importance of the market trend when interpreting TD Sequential signals is particularly valuable. Understanding how both bullish and bearish trends impact sell signals provides a more comprehensive view for traders aiming to optimize their strategies with XRP. Looking forward to trying these insights in my trading! helpful site
The detailed analysis of the TD Sequential Indicator’s sell signals is quite impressive! I particularly found the discussion on the role of volume in confirming sell signals to be insightful. This aspect can often be overlooked, but it’s crucial for making informed decisions with XRP trading. I’m eager to see how these signals play out in the current market conditions! check this out
The analysis of the specific sell signals from the TD Sequential Indicator is quite compelling! I found the detailed explanation of how to differentiate between exhaustion points and trend continuation particularly useful. This insight could really help traders refine their timing when analyzing XRP market movements. Eager to see how these signals play out in real scenarios! this one
The analysis of the different TD Sequential sell signals is incredibly insightful! I found the section on the relationship between sequential numbers and market psychology particularly compelling. It really highlights the need for traders to be aware of investor sentiment when assessing potential sell opportunities in XRP. This depth of analysis is essential for developing a nuanced trading strategy. see here
The explanation of the different phases of the TD Sequential Indicator and how they correspond to potential sell signals was particularly insightful. It’s fascinating to see how the indicator can help clarify entry and exit points for XRP trades, especially in fluctuating market conditions. This knowledge can truly enhance a trader’s approach to risk management. this resource
The discussion around the interplay between market volume and sell signals within the TD Sequential Indicator is quite insightful! I found your analysis particularly useful, especially how you highlighted that higher volume can often confirm sell signals, which many traders overlook. This nuanced approach can definitely help in refining trading strategies for XRP. check this out
The explanation of the various sell signals using the TD Sequential Indicator really clarifies how to spot potential exit points for XRP trades. I particularly found the focus on the interaction between price action and the indicator quite useful for formulating exit strategies. It’s an essential read for traders wanting to enhance their decision-making process! this resource
The detailed explanation of the different sell signals provided by the TD Sequential Indicator is quite impressive! I particularly enjoyed how you highlighted the potential impact of external market factors on XRP’s price movements. This context is crucial for making informed trading decisions. related tool